|
 |
 |
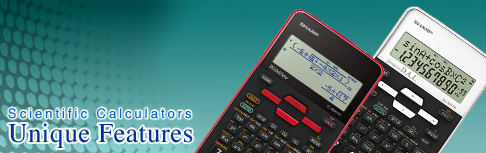
| The Reversible Keyboard gives you
a 2-in-1 Graphing Calculator. Keys for basic functions are on
one side, while keys for advanced functions are on the other.
Functions appearing on the menu display differ depending on
which side of the keyboard is being used. The Reversible Keyboard
saves you from having to get two separate models for different
levels. |
|
 |
| for use at junior high school level |
| Examples of Functions |
| • Fraction Study |
| Includes a function for simplifying fractions. Finds common
divisor either automatically or manually, leading to more effective
learning. |
 |
| • Pie Chart |
| Using a pie chart makes it easy to compare each part to the
whole. The data can be displayed either as raw numbers or as
percentages of the whole. |
 |
| • Remainder Calculation |
| Using the [int÷] key allows the user to calculate quotients
and remainders easily. |
 |
|
 |
| for use at high school level (includes
all the functions of the Basic Keyboard) |
| Examples of Functions |
| • Scientific Graphing |
| Graphs can be drawn in one of 4 modes: by rectangular coordinates,
by polar coordinates, by parameters, or by sequences. The Split
Screen makes it easy to analyse the relationship between a graph
and a table. |
 |
| • Statistics/Regression |
| Data can be easily input and revised in tabular form. You
can also draw a variety of graphs, such as statistical graphs
(9 types) and regression graphs (14 types), which are useful
for analysing data. |
 |
| Statistical graphs |
| • |
Histogram |
| • |
Broken line plot |
| • |
Normal probability plot |
| • |
Normal distribution plot |
| • |
Box plot/Modified box plot |
| • |
Pie chart |
| • |
Scatter diagram |
| • |
XY line |
|
| Regression graphs |
| • |
Linear regression (ax+b & a+bx) |
| • |
Quadratic/Cubic/Quartic regression |
| • |
Natural/Common logarithm regression |
| • |
Exponential regression/Euler exponential regression |
| • |
Reciprocal regression |
| • |
Power regression |
| • |
Med-Med regression |
| • |
Logistic regression |
| • |
Sine regression |
|
|
|
 |
|